Please quote this publication as follows:
Van de Vyver, J. and Meunier, F. 2015. A survey of existing OER resources in the field of language processing and their uptake: Belgium. URL: http://www.tellop.eu/survey-report-belgium/
1. Introduction
Altogether, there are 109 responses to the survey from Belgium, which amounts to 15.8% of the completed responses (690 in total) across the five participating countries. Although our survey has been distributed to a large number of institutions, we have put our main focus on institutions from the Federation Wallonia-Brussels. As a result, it appears that almost all the respondents work in an institution located in the French-speaking community of the country. Out of these 109 participants, 72.48% stated that they were not familiar with OERs at the beginning of Section C and thus were not asked to answer the subsequent questions of familiarity with and use of OERs. Therefore, the results of that last section are based on the data of the 18 respondents who said they were familiar with OERs, as well as the 12 other respondents who have heard of OERs but never used them.
2. Participant Profiles
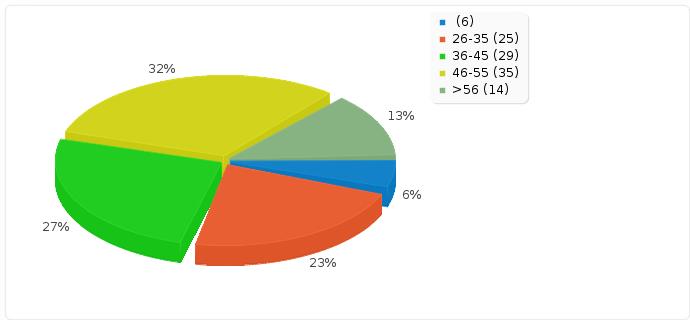
The ratio between the male (28%) and the female (72%) participants shows a much higher participation rate from female teachers, which reflects, in fact, the distribution of male and female teachers in the country. As can be seen in Figure 1, the most common age group among the subjects is the 46-55 range (32.11%), closely followed by the 36-45 range (26.61%), 26-35 range (22.94%) and finally the subjects over 56 (12.84%) and those under 26 (5.50%).
Figure 1. Age distribution of participants
Level of Education and training background
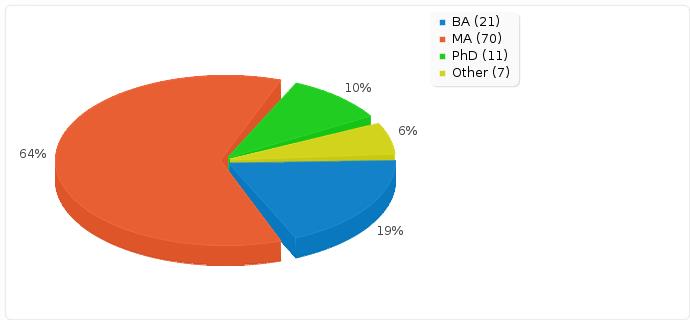
Figure 2. Educational background of participants
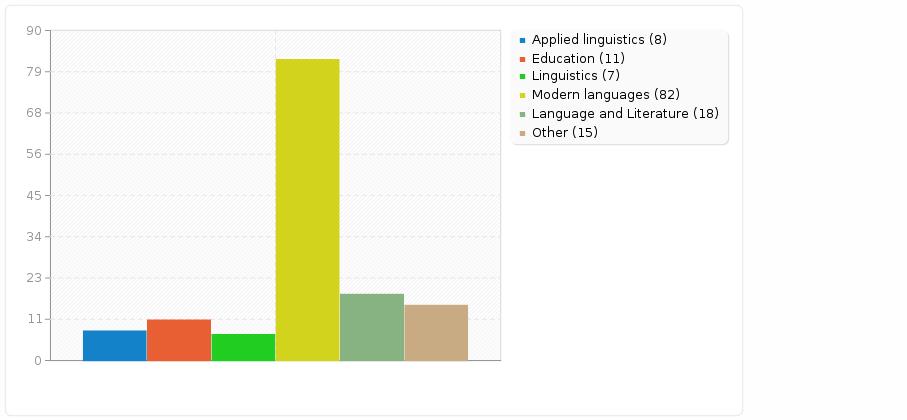
The highest number of participants were MA graduates (70, viz.64.22%), followed by BA (21, 19.27%) and PhD holders (11, 10.09%). When asking for their previous training background, the majority reported that they had had their training in Modern Languages (82, 75.23%), which is the most common certificate MA teachers obtain at university in Belgium. Some of the respondents chose more than one category for their training background because the Modern Languages certificate in the Belgian context includes majors in linguistics, literature or education. The participants who reported they had studied applied linguistics (8, 7.34%) are higher education teachers.
Figure 3. Previous training background of participants
Years of Experience in Language Teaching
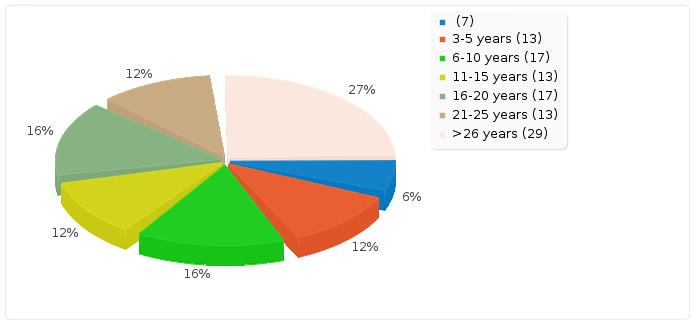
Figure 4. Years of experience in language teaching
As illustrated in Figure 4, most participants of the survey are rather experienced in language teaching, which correlates with the participants’ age groups. The most frequent group has over 26 years of experience (26.61%). The other categories include 13 to 17 participants (11.93 to 15.60%), which can be claimed to be an acceptable distribution of participants for experience. Unfortunately, the category representing the new teachers with less than 3 years of experience only contains 7 respondents, which corresponds to only 6.42% of our population and is therefore underrepresented in the survey.
Institutional Background
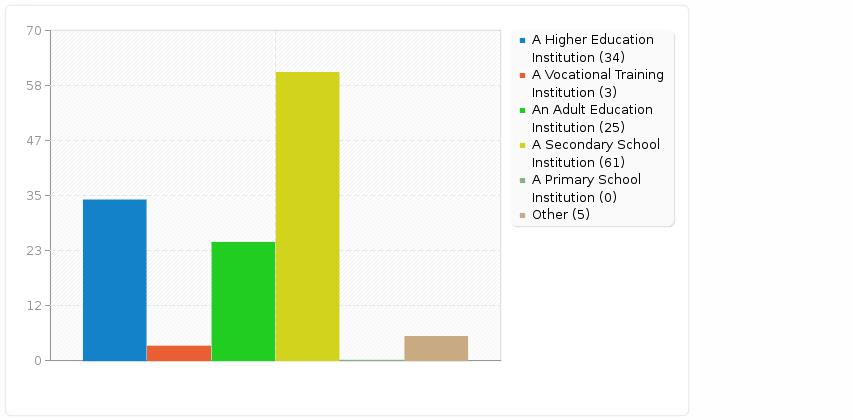
Figure 5. Institutional background
As we can see in Figure 5, the majority of the participants are secondary school teachers (55.96%), followed by higher education teachers (31.19%) and adult education teachers (22.94%).
Main language taught by the Teachers
In the Belgian context, most of the foreign language teachers in secondary school are used to teaching two foreign languages. However, the participants were asked in this survey to report the main language they teach. The results show that most of them (49, 44.45%) teach English as a foreign language; it should be noted that 11 of them (10.09%) chose English as a second language. As English in our local Belgian context is almost exclusively a foreign language, all these respondents can be considered as teachers of English as a foreign language (EFL), which means that 54.54% of the participants are in fact EFL teachers. 28 other participants (25.68%) teach Dutch as a foreign language. The remaining 20% include Spanish (7), German (5) and Italian (4) as foreign languages as well as French as a second language (4). Only one teacher reported teaching sign language.
3. Technology and Mobile Devices
Students’ Access to WI-FI at Institutions
According to the participants, higher education students have access to WI-FI (97%). Results show, on the other hand, that only 21 out of 61 pupils in secondary education do have access to WI-FI (34.43%), which is very low compared to some of the figures found in other countries (Spain : 83.33%; the UK : 83.93%). WI-FI access in secondary school institutions is a real challenge in the country and constitutes a real issue for teachers. Finally, it appears that 41% of the learners in adult education have access to a WI-FI connection.
Institutional Support for the Use of Mobile Devices
A vast majority of the participants (87, 79.82%) feel their institution does not foster the use of mobile devices in their teaching. This figure is even higher if we only consider secondary education teachers’ responses (85.24%) and is then followed by the figure for adult education (82.35%) and then by the figure for higher education (71.42%). In any case, this figure is particularly high and needs further investigation.
Training Background for the Use of Mobile Devices in Teaching
According to the results of the survey, out of 109 participants, only 11 (10.09%) reported they had received training in their professional background.
Computer Skills of Teachers
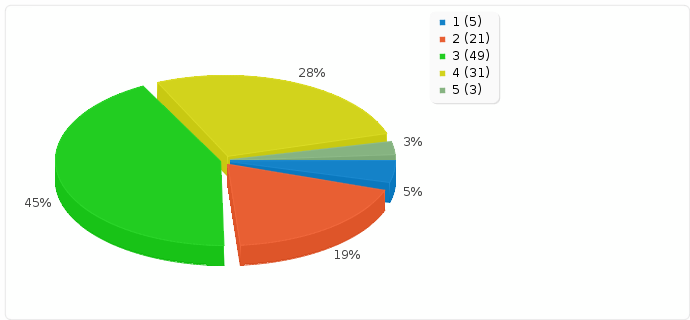
Figure 6. Computer skills of the teachers
Illustrated in Figure 6 is the teachers’s perception of their computing skills (from 1 representing no knowlegde about computers to 5 corresponding to expert user). We can see from the results that the majority of the participants rated themselves either at level 2 (19%), 3 (45%) or 4 (28%). We can notice, on the one hand, that only 3% reported they had perfect mastery of computer skills but also, on the other hand, that not more than 5% stated they had no knowledge at all about computers.
Devices and the Frequency of their Use in Teaching by the Teachers
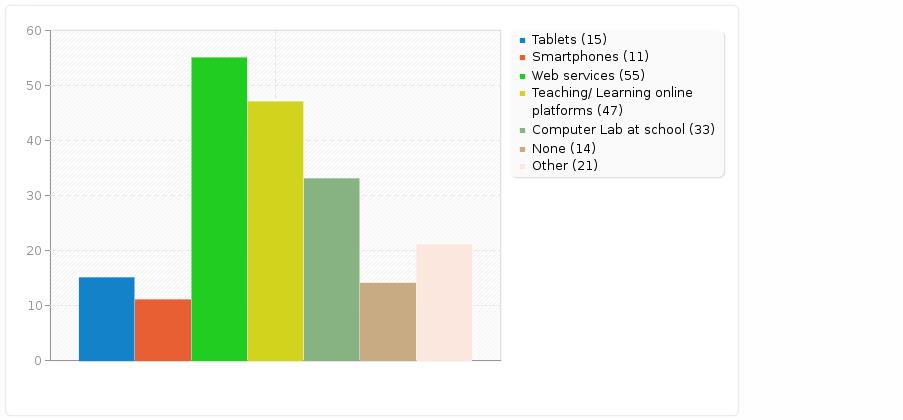
Figure 7. Devices used by teachers
The answers given by the participants show that web services are the most common devices teachers use in their teaching (55, 50.46%), followed by teaching/learning online platforms (47, 43.12%), and computer labs at school (33: 30.28%). Tablets are used by 15 respondents (13.76%), smartphones by 11 respondents (10.09%). The category ‘other’ (19.27%) included devices such as laptops, data projectors and interactive whiteboards. 14 participants(12.84%), mostly coming from secondary institutions did not use any devices in their teaching.
Belgian teachers were then asked about the frequency with which they use mobile devices in their language teaching. Out of 109 participants, 48 (44.04%) reported they never used them. 24 respondents (22.02%) claimed they used these devices a few times a year, 17 others (15.6%) chose ‘on a weekly basis’, 12 (11.01%) reported they used the devices every day and the remaining 8 (7.34%) reported a ‘monthly’ use.
Teachers’ Assumption of How Frequently Students Use Mobile Devices in their Language Learning
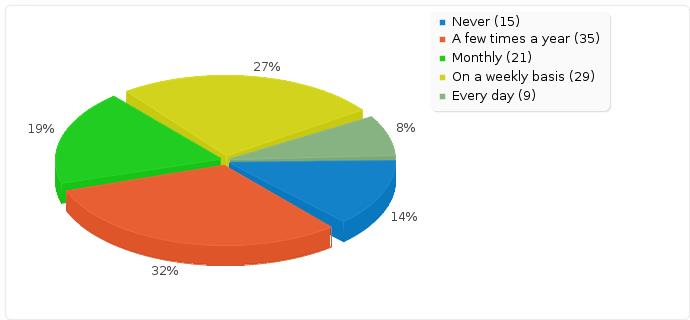
Figure 8. Students’ use of mobile devices for language learning
The participants were asked about their assumptions of how frequently their students used mobile devices to learn languages. The results show that 38 (34.86%) of them think that their students use such devices on a weekly basis to every day; 21 (19.27%) think that they use them monthly; and 35 (32.11%) think that they use them a few times a year only. Finally, 15 (13.76%) of them think that their students never use mobile devices to learn languages. A comparison between what they do and what they think their students do, shows that their students tend to use mobile devices more frequently than the teachers themselves.
4. Open Educational Resources (OERs)
Teachers’ Familiarity with OERs
In Section C of the Survey, the first question addressed teachers’ familiarity with OERs. As stated in the introduction, the vast majority of respondents (79:72.48%) answered they were not familiar with OERs, whereas 18 others only (16.51%) said they were familiar with them. Besides, 12 of them (11.01%) chose the second option and said they heard of but never used them. The follow-up question regarding the interest of teachers in knowing more about OERs offered a very positive response. 81 participants (74.31%) said they wanted to know more about OERs while only 7 people (6.42%) chose ‘no’. 21 respondents (19.27%) did not answer this optional question.
Frequency of OER Use by Teachers in General and in the Context of Language Teaching
The remaining survey questions were asked only to participants who had indicated they were familiar with OERs or who had at least heard of them. From now on, we report the findings based on answers from 30 teachers who answered this section of the survey. The first question was about teachers’ use of OERs in general.
Table 1
Use of OERs in General and in the Context of Language Teaching by Teachers
| Frequency of Use | In General | In Language Teaching |
| Never | 10 (33.3%) | 11 (36.7%) |
| A few times a year | 5 (16.7%) | 4 (13.3%) |
| Monthly | 5 (16.7%) | 7 (23.4%) |
| On a weekly basis | 6 (20%) | 4 (13.3%) |
| Every day | 4 (13.3%) | 4 (13.3%) |
As can be seen in Table 1, out of 30 teachers, 10 of them (33.3%) answered that they never use OERs, the rest of the options is nearly equally distributed with about 5 respondents (16.7%) per option. The second question (under the same sub-section) tackled teachers’ use of OERs in their teaching. Similar to their use of OERs in general, 11 of the teachers (36.7%) answered that they ‘never’ use OERs in their teaching. It is followed by the ‘monthly’ option, chosen by 7 teachers (23.4%). The rest of the categories was chosen by 4 respondents each and show once more a rather equal distribution between the different options. Looking at the percentages it can be concluded that a third of the teachers never used OERs in language teaching specifically, but also in general.
Teachers’ Familiarity with and Use of OER Technologies in Language Teaching
Table 2
Teachers’ Familiarity with and Use of Certain OER Technologies in Language Teaching
| OER Technology | Familiarity score | Familiarity ranking | Use score | Use ranking |
| Online dictionaries | 129 | 1 | 102 | 1 |
| Online collocation dictionaries or databases | 81 | 2 | 71 | 2 |
| Spell checkers | 81 | 3 | 57 | 3 |
| L1 corpora | 70 | 4 | 56 | 4 |
| Language learning apps | 63 | 5 | 53 | 5 |
| Specialized corpora | 63 | 6 | 44 | 7 |
| Visual representation of word clusters | 61 | 7 | 41 | 10 |
| Learner corpora | 60 | 8 | 48 | 6 |
| Automated word lists and frequency counts | 57 | 9 | 44 | 8 |
| Text-to-speech technologies | 55 | 10 | 42 | 9 |
| Wordnet | 51 | 11 | 38 | 11 |
| Vocabulary profiling | 50 | 12 | 38 | 12 |
| Lemmatizers | 50 | 13 | 34 | 14 |
| Online corpus management tools | 46 | 14 | 34 | 15 |
| Automated Part of speech tagging | 46 | 15 | 33 | 16 |
| Text density/readability index | 43 | 16 | 33 | 17 |
| Text summarization | 39 | 17 | 36 | 13 |
| AVERAGE SCORE | 61 | 47 |
In order to find out which OER technologies the participants were familiar with and used in their teaching, frequency counts were converted to scores for each OER listed in the survey. This is done by using numerical values (never heard of it=1, heard of it but never used=2, sometimes use it=3, use it frequently=4, always use it=5), and multiplying their frequencies and adding them up for each OER. As can be seen in Table 2, the first three OERs teachers are the most familiar with include ‘online dictionaries’, ‘online collocation dictionaries or databases’ and ‘spell checkers’, which have the same rankings for their frequency of use. Besides, results show that even though online collocation dictionaries/databases and spell checkers are second and third on the list, a third of the respondents reported that they had never heard of that technology. The three OERs the teachers are the least familiar with are ‘automated part of speech tagging’, ‘text density/readability index’ and ‘text summarization’ while the least frequently used three OERs by the teachers are again ‘automated part of speech tagging’, ‘text density/readability index’ but this time with ‘online corpus management tools’. From the results we can also notice that two thirds of the respondents are not familiar with these 4 types of technologies in language teaching.
As can be expected, teachers’ familiarity levels were found to be higher for all the OERs than their frequency of use. While the average score for familiarity level was found to be 61, it was 47 for the frequency of use.
When teachers were asked about other technologies they had heard of or used in their teaching of languages, they mentioned for example different learning websites such as BBC, British Council, Busyteacher, esl-lab and Wallangues.be, as well as some other tools like learning management software, a concordancer software programme (AntConc) and e-portfolios.
Teachers’ Expectations from an OER Application that Makes Use of Language-processing Technologies
At the end of the survey, all the participants were asked to tell us about their expectations from an OER application that makes use of language-processing technologies. 54 participants answered this optional question. With a content analysis approach we categorized their expectations as follows:
- App use-related expectations
- User friendly
- Useful
- Easy to use
- Fun
- Not sophisticated
- With an added value
- Integration of teacher and student platforms
- Exploitable from home
- Innovative
- Interactive
- Personalized
- Language-related expectations
- Easy access to authentic audio-visual resources (news, real-life documents, feature articles, etc.)
- Thematic vocabulary lists with examples and pronunciation
- Level-adapted vocabulary lists, texts
- Audience-adapted material (language for specific purposes, activities for teenagers)
- Grammar theory (easy to access)
- Language in context (collocations, specific purposes, translation in context, frequency information)
- Easy access to L1 corpora for language checks
- Learning-related expectations
- Communicative activities
- Skill-based approach (oral and written expression with roleplays,…)
- Pronunciation, grammar, vocabulary, syntax theory & practice
- Easy exploitation of learner data
- Learner progress report
- Cross-checking assignments – submission of different drafts by students
- Material for self-learning
- Level appropriate exercises and activities
- Initial level assessment
- Activities in line with the curriculum (lexical fields, language functions, etc.)
5. Conclusion
Based on these results from the French-speaking part of Belgium, it can be concluded that the majority of the participants are not familiar or have never used OERs in their language teaching. However, most of them are eager to learn more about OERs and would like to use them in their classroom. Out of the respondents who claimed they knew about OERs, it seems that one third of them never uses OERs be it in general, or in their language teaching. In their expectations, they stated that they want such mobile apps to be user friendly, efficient, easily accessible and simple. The learners, especially teenagers, need challenging, attractive and appealing activities.
