Please quote this publication as follows:
Ordoñana, C., Pérez-Paredes, P. Aguado, P. & Sánchez, P. 2015. A survey of existing OER resources in the field of language processing and their uptake: Spain. URL: http://www.tellop.eu/survey-report-spain/
DOI: 10.13140/RG.2.1.4455.1125
1. Introduction
The results for the TELL-OP survey, active from May 22nd to June 30th, show a general participation of 1170 surveyed people, of which 690 have completed all the required fields in the questionnaire. The number of participants based in Spain rose up to 131.
The survey is composed of three main blocks: Block A deals with the personal data of the subject, with questions related to age, gender, education, etc. Block B deals with questions related to technology and mobile devices and Block C deals with the knowledge the participants have on open educational resources (OER) and its different tools.
2. Personal Data
Results from Block A show that participants were predominantly women (67.94%); the most common age group among the subjects is 36-45 years old (41.98%), followed by 46-55 (33.59%), 26-35 (16.79%) and finally the subjects over 56 years old (6.87%).
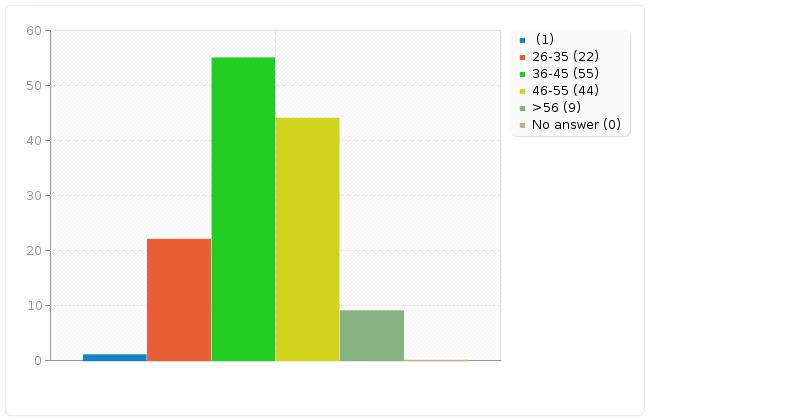
Figure 1 – Age group of the participants
The most common academic qualifications the subjects possess are PhD (38.93%) and BA (32.82%), while 19.85% of the participants have an MA. When asking for their previous training background, the majority of the participants answered Modern Languages (48.09%), followed by Applied Linguistics (37.40%) and Education (39.69%). Regarding the years of experience in teaching, the participants have among 11-15 (29.01%) and 16-20 years of experience (20.61%).
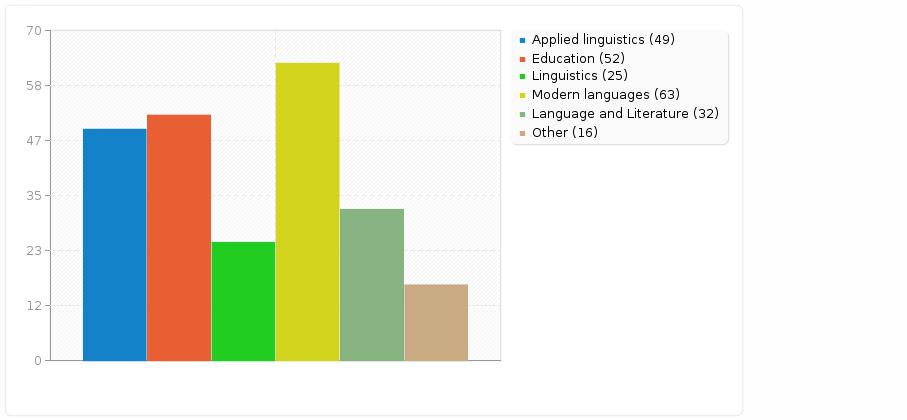
Figure 2 – Previous training Background of the participants
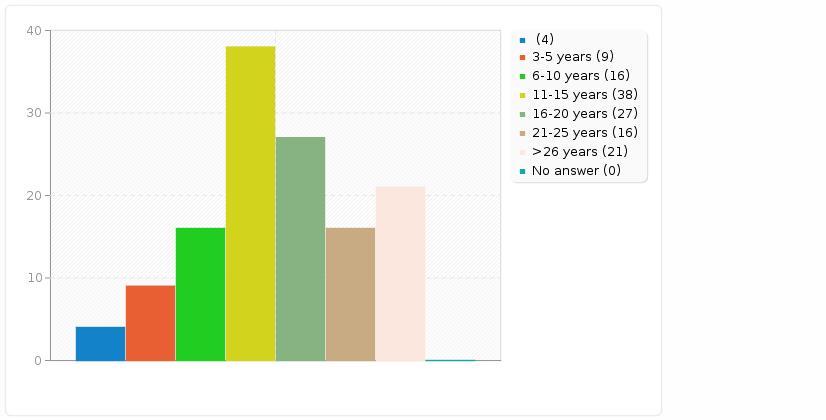
Figure 3 – Years of experience in teaching of the participants
The vast majority of the surveyed people work on a higher education institution (44.27%), Secondary (22.90%) and Primary school (19.85%) also being an important part of the subjects’ workplace, and English as a foreign language is the subject most of the participants teach (71.76%). 94.66% of the participants agreed to provide their e-mail for future participation in the TELL-OP project.
3. Technology & Mobile Devices
Moving on to Block B, the amount of students who have access to WiFi in their institutions is significantly higher (83.97%) than the ones who do not have it (16.03%). However, the percentages are quite close to each other when referring to the fostering from the institutions of the use of mobile devices in the teaching context.
The results from the question related to whether the subject has received any training in the use of mobile devices from their respective institutions show that the vast majority has not received any whatsoever (76.34%). When the participants were requested to evaluate their computer skills (1 being no knowledge about computers and 5 being perfect computer skills) 41.22% of the surveyed people answered both 3 and 4, and none considered having no idea about computers.
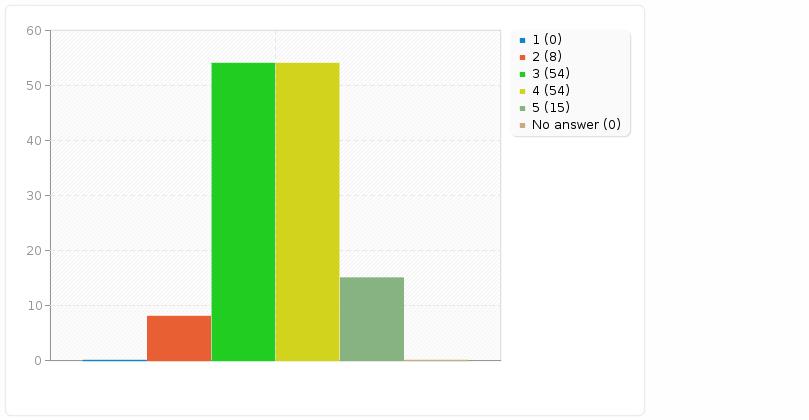
Figure 4 – Participants’ computer skills
Regarding which devices the subjects use in the teaching context, web services (77.86%) and teaching/ learning online platforms (74.05%) are the most frequently used, followed by the schools’ computer labs (56.49%). Interestingly, only 0.76% of the subjects answered that they do not use any device in the classroom. However, when they were asked about the frequency with which they use mobile devices in their language teaching, 25.19% said “never”, followed closely by “a few times a year” (22.14%).
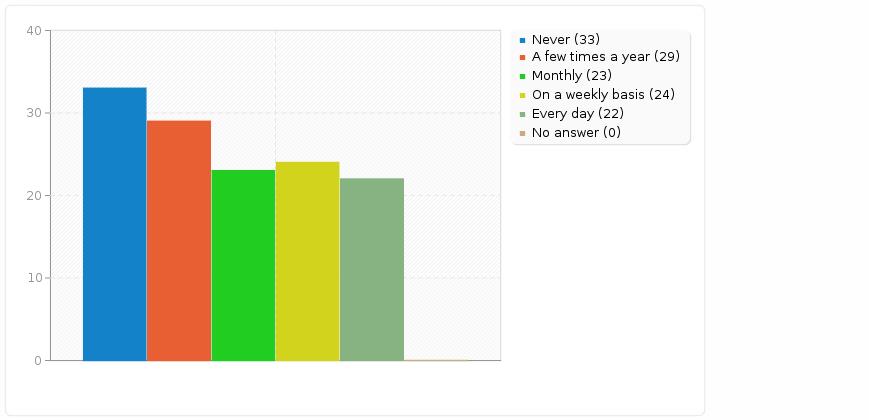
Figure 5 – Participants’ frequency of use of mobile devices in language teaching
The last question in Block B is related to the frequency with which the participants think their students use mobile devices for their language learning, and the results show that most of the subjects answered “on a weekly basis” (31.30%) and “every day” (26.72%).
4. Open Educational Resources
Block C’s first question asked the participants if they were familiar with OERs. The results show that most of the subjects were familiar with OERs (41.98%), while 35.88% were not; 22.14% had heard of them, but never used them. As the following question (“Are you interested in knowing more about OERs?”) was not mandatory, 16.79% chose not to answer; however, only one person (0.76%) said “no” to knowing more about OERs, while 82.44% of the subjects marked “yes”.
The subsequent questions only appeared to those who had marked “yes” in Block C’s first question. Thus, 55 out of 131 people were answering the remaining parts of the questionnaire. The participants were asked about the frequency with which they use OERs, and while most of them said “a few times a year” (28.57%), the remaining answers show a similar percentage.
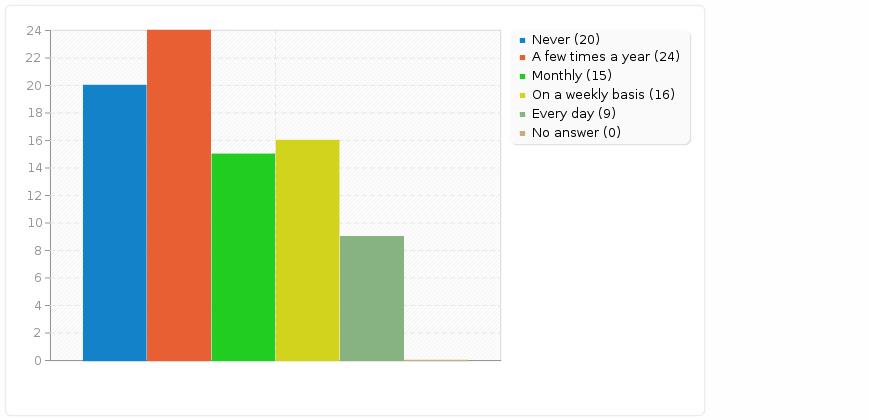
Figure 6 – Participants’ frequency of use of OERs
Table 1 Teachers’ Familiarity with and Use of Certain OER Technologies in Language Teaching
| OER Technology | Familiarity score | Familiarity ranking | Use score | Use ranking |
| Online collocation dictionaries or databases | 332 | 01 | 245 | 01 |
| Spell checkers | 248 | 02 | 164 | 03 |
| Language learning apps | 227 | 03 | 155 | 04 |
| L1 corpora | 200 | 04 | 133 | 05 |
| Text-to-speech technologies | 190 | 05 | 128 | 06 |
| Specialized corpora | 181 | 06 | 128 | 07 |
| Automated word lists and frequency counts | 171 | 07 | 124 | 09 |
| Visual representation of word clusters | 167 | 08 | 125 | 08 |
| Learner corpora | 166 | 09 | 118 | 10 |
| Online dictionaries | 159 | 10 | 315 | 01 |
| Wordnet | 145 | 11 | 118 | 11 |
| Online corpus management tools | 145 | 12 | 103 | 14 |
| Text summarization | 136 | 13 | 106 | 12 |
| Lemmatizers | 133 | 14 | 099 | 16 |
| Vocabulary profiling | 133 | 15 | 105 | 13 |
| Text density/readability index | 127 | 16 | 101 | 15 |
| Automated Part of speech tagging | 120 | 17 | 098 | 17 |
| AVERAGE SCORE | 175 | 139 |
In order to find out which OER technologies the participants were familiar with and use in their teaching, frequency counts were converted to scores for each OER listed in the survey. This is done by using numerical values (never heard of it=1, heard of it but never used=2, sometimes use it=3, use it frequently=4, always use it=5), and multiplying their frequencies and adding them up for each OER. As can be seen in Table 2, the first three OERs teachers are the most familiar with include ‘online collocation dictionaries and databases’, ‘spell checkers’ and ‘language learning apps’, but only ‘online collocation dictionaries and databases ‘ shares same ranking for its frequency of use. The three OERs the teachers are the least familiar with are ‘Vocabulary profiling’, Text density/readability index’, and ‘automated part of speech tagging’, being the latter the least frequently used OER by the teachers.
As can be expected, teachers’ familiarity levels were found to be higher for all the OERs than their frequency of use. While the average score for familiarity level was found to be 175, it was 139 for the frequency of use. However, Spearman Rank-order Correlation was found to be significant at p<.01 level between their familiarity and use rankings (rho=.86). That is, teachers’ familiarity level determines how frequently they use a certain OER.
The following group of questions is related to the familiarity of the participant with certain technologies. While in most of the different technologies represented in the question the predominant answer is “never heard of” or “I have heard of but never used it”, tools such as online dictionaries do have a high relevance among the participants (38.10% for “I use it frequently” and 53.57% for “I always use it”). A similar case occurs with Online collocation dictionaries or databases (27.38% for “I use it frequently” and 39.29% for “I always use it”). The only case with more or less even answers is the spell checkers tools, whose results show that 25.00% of the subjects have heard but never used it and 20.24% use it frequently.
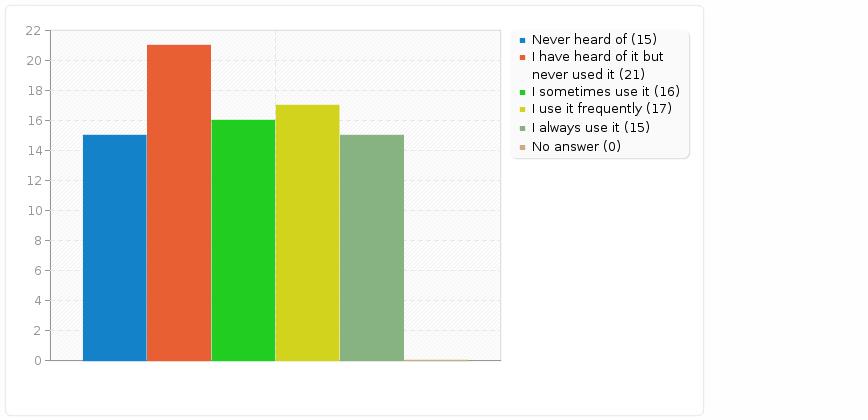
Figure 7 – Familiarity of the participants with Spell checker tools
The case is similar with the second and last group of questions (“how often do you make use of them in your language teaching?”), being “never” and “a few times a year” the predominant answers in most of the tools, with the exceptions of online dictionaries (34.52% for both “on a weekly basis” and “every day”) and online collocation dictionaries or databases, although in the latter, the most marked answer is still “never” (28.57%), followed by “every day” (21.43%).
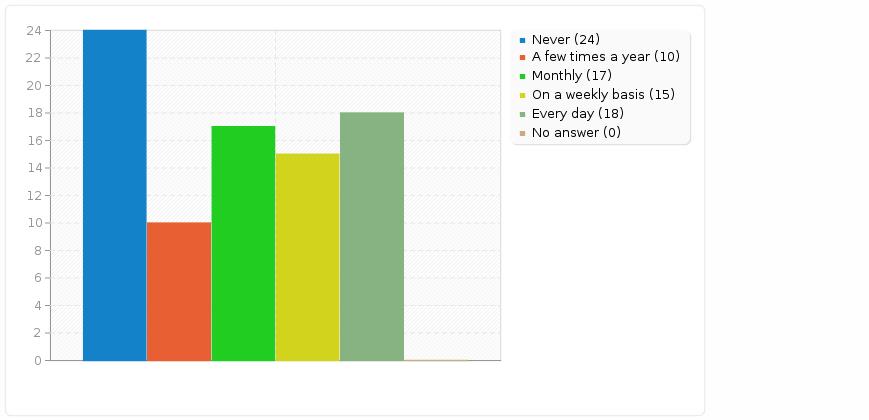
Figure 8 – Frequency of use in teaching context of online collocation dictionaries or databases
5. General Overview
Looking at the data obtained, we could conclude that the access to mobile devices in education institutions is increasing, although the teachers lack the information and preparation necessary to fully embrace the benefits of mobile devices and OERs. Most of the tools that could be useful to improve language teaching are generally unknown, and therefore underused, their benefits lost. The fact that the vast majority of the teachers surveyed show interest in knowing more about OERs is indicative that more effort should be put in the spread of mobile devices and language learning technologies.